
Qlik Sense Essential Training - Analyze data with Qlik Sense 
Learn how to analyze and display data effectively using Qlik Sense, a powerful platform that enables you to create stunning visualizations and reports. Enhance your data analysis skills by creating various charts, tables, and interactive presentations that effectively convey your message. Get a comprehesive understanding of this course which is a free trail course. AZ Class provides this course data for free. Learn more certificate and details here. ▼
ADVERTISEMENT
Course Feature
![]() Cost:
Cost:
Free Trial
![]() Provider:
Provider:
LinkedIn Learning
![]() Certificate:
Certificate:
No Information
![]() Language:
Language:
English
![]() Start Date:
Start Date:
Self Paced
Course Overview
❗The content presented here is sourced directly from LinkedIn Learning platform. For comprehensive course details, including enrollment information, simply click on the 'Go to class' link on our website.
Updated in [October 18th, 2023]
What does this course tell?
(Please note that the following overview content is from the original platform)
How to analyze and display data using this powerful platform
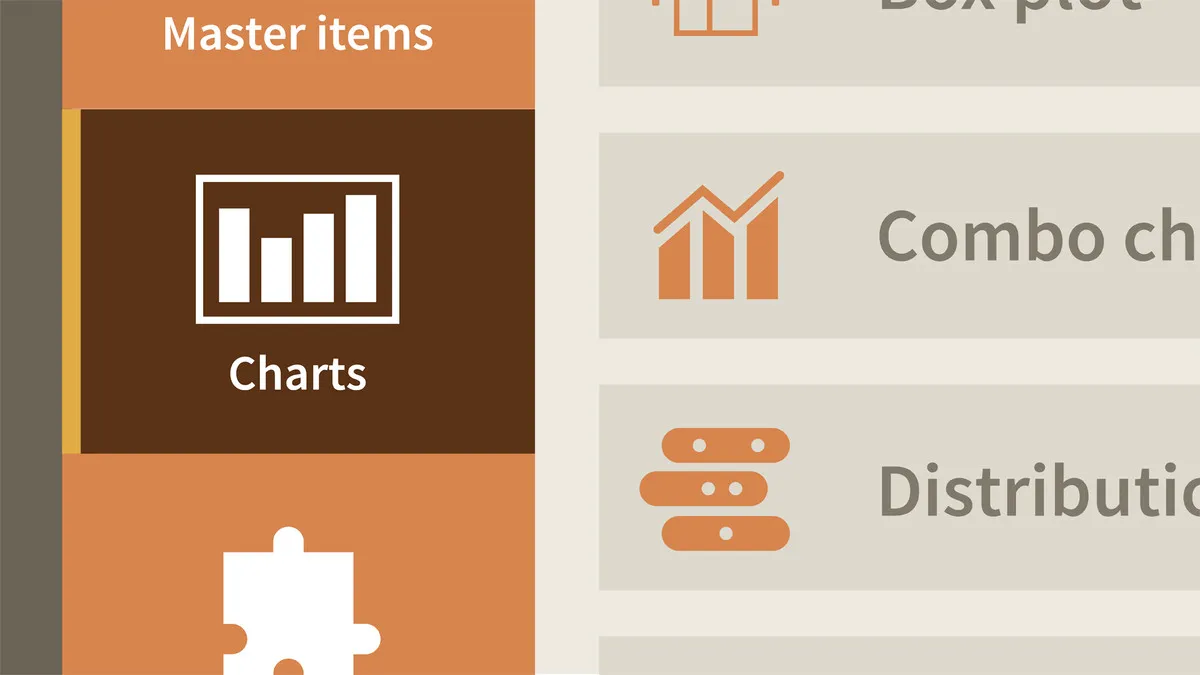
How to create and manipulate a variety of data visualizations from bar charts to histogram charts; create PivotTables and reports; sort and filter data; and combine your apps sheets with objects text and images to create a story that clearly conveys your message
We considered the value of this course from many aspects, and finally summarized it for you from two aspects: skills and knowledge, and the people who benefit from it:
(Please note that our content is optimized through artificial intelligence tools and carefully reviewed by our editorial staff.)
What skills and knowledge will you acquire during this course?
During the Qlik Sense Essential Training course, learners will acquire the following skills and knowledge:
1. Analyzing and displaying data: Learners will learn how to effectively analyze and display data using the Qlik Sense platform.
2. Creating data visualizations: Learners will gain the ability to create various types of data visualizations, including bar charts, histogram charts, and more.
3. Manipulating data visualizations: Learners will learn how to manipulate and customize data visualizations to suit their specific needs and requirements.
4. Creating PivotTables and reports: Learners will acquire the skills to create PivotTables and reports to organize and summarize data in a meaningful way.
5. Sorting and filtering data: Learners will understand how to sort and filter data to focus on specific aspects or patterns within the dataset.
6. Combining apps, sheets, and objects: Learners will learn how to combine different elements such as text, images, and objects to create a cohesive and impactful story that effectively conveys their message.
Overall, this course will equip learners with the necessary skills to analyze and present data using Qlik Sense, enabling them to make informed decisions based on data insights.
Who will benefit from this course?
Data Analysts and Data Scientists: Data professionals seeking to enhance their skills in data analysis and visualization will find this course valuable. It provides insights into utilizing Qlik Sense for effective data analysis and visualization.
Business Analysts: Business analysts aiming to analyze and present data to make informed business decisions will benefit from this course. It covers creating data visualizations and reports that aid in understanding business data.
Report and Dashboard Developers: Professionals involved in designing reports and dashboards can leverage the training to learn how to create interactive data visualizations and combine them to present a coherent data story.
Business Intelligence (BI) Professionals: BI specialists looking to expand their knowledge of data analysis tools will find this course useful. It focuses on using Qlik Sense to analyze and display data for business intelligence purposes.
Managers and Decision-Makers: Managers and decision-makers interested in gaining a better understanding of data analysis and visualization will find this course beneficial. It helps in comprehending data trends and patterns for informed decision-making.
Course Syllabus
Introduction
Course Provider

Provider LinkedIn Learning's Stats at AZClass
Discussion and Reviews
0.0 (Based on 0 reviews)
Explore Similar Online Courses

Elixir Programming for Beginners

Health Coaching: Permanent Weight Loss

Python for Informatics: Exploring Information

Social Network Analysis

Introduction to Systematic Review and Meta-Analysis
The Analytics Edge

DCO042 - Python For Informatics
Causal Diagrams: Draw Your Assumptions Before Your Conclusions
Whole genome sequencing of bacterial genomes - tools and applications

QlikView Server and Publisher

Business intelligence Talend Data integration ETL & Qlikview

Start your review of Qlik Sense Essential Training - Analyze data with Qlik Sense