

Augmented Data Visualization with Machine Learning 
This course is designed for business analysts who want to learn the latest data visualization capabilities with Oracle Analytics. Through hands-on activities, you will learn how to build modern data visualization projects and use machine learning models for predictive analytics. You will also get to explore different use cases such as sales analysis, school donation analysis, HR attrition analysis, and more. With video and screencast tutorials, demo files, and scripts to download, you can jump right in and try it out with your own data set. Analytically Yours, your instructors are here to help you explore the exciting new world of data visualization. ▼
ADVERTISEMENT
Course Feature
![]() Cost:
Cost:
Free
![]() Provider:
Provider:
Udemy
![]() Certificate:
Certificate:
No Information
![]() Language:
Language:
English
![]() Start Date:
Start Date:
2019-05-08
Course Overview
❗The content presented here is sourced directly from Udemy platform. For comprehensive course details, including enrollment information, simply click on the 'Go to class' link on our website.
Updated in [August 31st, 2023]
Skills and Knowledge:
By the end of this course, you will have acquired the skills and knowledge to:
1. Understand the fundamentals of Oracle Analytics and its capabilities.
2. Create data visualizations with Oracle Analytics.
3. Utilize advanced data flow features to create complex data visualizations.
4. Build machine learning models for predictive analytics.
5. Analyze data sets with different use cases such as sales analysis, school donation analysis, HR attrition analysis, etc.
6. Utilize your own data sets to create data visualizations.
7. Understand the importance of data visualization in business intelligence.
Professional Growth:
This course contributes to professional growth by providing hands-on training with Oracle Analytics and machine learning models for predictive analytics. It also provides a comprehensive overview of data visualization and augmented analytics, which are essential skills for business analysts. Additionally, the course provides a variety of projects to work on, such as sales analysis, school donation analysis, HR attrition analysis, and advanced projects such as machine learning models for predictive analysis. This course is designed to help business analysts gain the skills and knowledge necessary to use analytics in their business and to create modern data visualization projects.
Further Education:
This course is suitable for preparing for further education. It covers topics such as machine learning models for predictive analytics and advanced data flow features, which are relevant in the field of data visualization and analytics. The course also provides hands-on training with Oracle Analytics, which is a widely used tool in the industry. Additionally, the course offers various projects and demos that allow learners to apply their knowledge and skills to real-world scenarios. Overall, this course can help learners enhance their understanding and proficiency in data visualization and analytics, which can be valuable for further education and career advancement in related fields.
Course Syllabus
Course Introduction
Selecting Data Sets from Different Data Sources
Data Flow Deep-Dive with Oracle Analytics
Advanced Analytics Made Easy with Oracle Analytics
Machine Learning with Data Visualization
Top 10 Features Worth Learning about Oracle Analytics
Course Provider

Provider Udemy's Stats at AZClass
Discussion and Reviews
0.0 (Based on 0 reviews)
Explore Similar Online Courses

10 intermediate guitar solos for musicians

Microsoft Azure Databricks for Data Engineering

Python for Informatics: Exploring Information

Social Network Analysis

Introduction to Systematic Review and Meta-Analysis
The Analytics Edge

DCO042 - Python For Informatics

Causal Diagrams: Draw Your Assumptions Before Your Conclusions
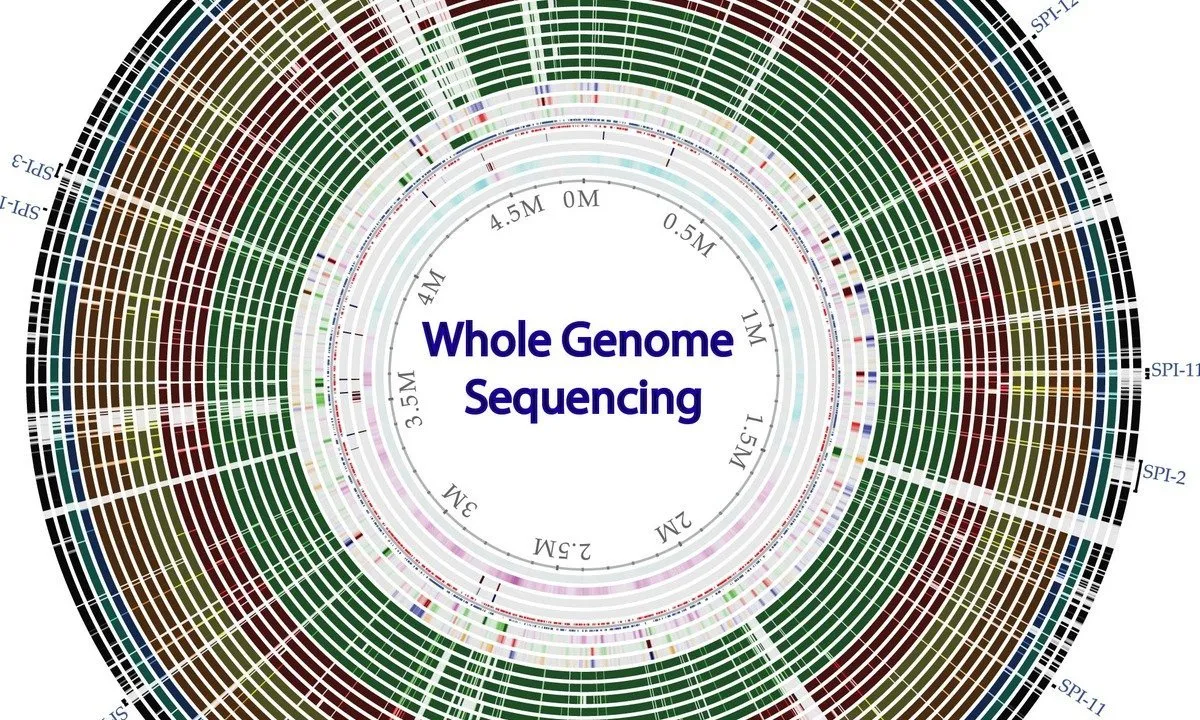
Whole genome sequencing of bacterial genomes - tools and applications

Data Visualization

Data Visualization and D3js
Start your review of Augmented Data Visualization with Machine Learning