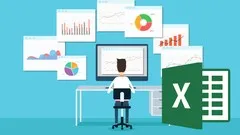
Microsoft Excel - Basic Data Visualization in Excel 
This course is perfect for anyone looking to take their Excel skills to the next level. Learn and master the art of creating well-designed data visualizations and basic data analysis in Excel. With this course, you'll go beyond the basics of graphing and learn how to design graphs with your intended audience in mind. You'll also learn how to organize your data before graphing, use vlookups to enhance your datasets, and use your visualizations outside of Excel. Plus, you'll get all the Excel spreadsheets used throughout the course to use as a reference in the future. So, join this course and start creating amazing data visualizations that will wow your boss and coworkers! ▼
ADVERTISEMENT
Course Feature
![]() Cost:
Cost:
Free
![]() Provider:
Provider:
Udemy
![]() Certificate:
Certificate:
No Information
![]() Language:
Language:
English
![]() Start Date:
Start Date:
2015-11-02
Course Overview
❗The content presented here is sourced directly from Udemy platform. For comprehensive course details, including enrollment information, simply click on the 'Go to class' link on our website.
Updated in [August 31st, 2023]
Skills and Knowledge:
In this course, students will acquire the following Skills and Knowledge:
- How to determine if data is graph-worthy
- How to organize data prior to visualization
- Using vlookups to enhance datasets
- Designing graphs for an intended audience
- Using visualizations outside of Excel
- How to create great graphs in Excel
- How to use Excel spreadsheets as a resource
- How to implement the skills learned in the course immediately
- How to wow bosses and coworkers with data visualizations.
Professional Growth:
This course will help professionals to develop their skills in data visualization and analysis, which is a valuable asset in the workplace. Professionals will be able to use the skills they learn in this course to create more effective and visually appealing data visualizations, which can be used to make better decisions and improve their performance. Additionally, the course will help professionals to better organize their data before graphing, which can save time and make the process more efficient. By mastering the art of data visualization and analysis, professionals will be able to demonstrate their expertise and stand out from the competition.
Further Education:
This course is suitable for preparing for further education. It covers topics such as data organization, data visualization, and basic data analysis in Excel, which are fundamental skills that can be applied in various educational and professional settings. Additionally, the course provides resources and spreadsheets that can be used as references in the future.
Course Syllabus
Intro
Preparation
Graphing your Data
Special Styles
Wrapup
Course Provider

Provider Udemy's Stats at AZClass
Discussion and Reviews
0.0 (Based on 0 reviews)
Explore Similar Online Courses

PI-101 Top 10 Classical Piano Pieces for Beginners

Metabase Data Visualization & BI Platform
Python for Informatics: Exploring Information

Social Network Analysis

Introduction to Systematic Review and Meta-Analysis
The Analytics Edge

DCO042 - Python For Informatics
Causal Diagrams: Draw Your Assumptions Before Your Conclusions
Whole genome sequencing of bacterial genomes - tools and applications

Augmented Data Visualization with Machine Learning

Data Visualization


Start your review of Microsoft Excel - Basic Data Visualization in Excel