
Introduction to Data Analysis using Excel 
Get a comprehensive overview of Introduction to Data Analysis using Excel ▼
ADVERTISEMENT
Course Feature
![]() Cost:
Cost:
Free Trial
![]() Provider:
Provider:
QuickStart
![]() Certificate:
Certificate:
No Information
![]() Language:
Language:
English
![]() Start Date:
Start Date:
Self Paced
Course Overview
❗The content presented here is sourced directly from QuickStart platform. For comprehensive course details, including enrollment information, simply click on the 'Go to class' link on our website.
Updated in [May 19th, 2023]
This course provides an introduction to data analysis using Microsoft Excel. It is designed to help students gain a basic understanding of the features and functions of Excel, and how to use them to analyze data.
The course begins with an overview of the Excel interface and its basic features. Students will learn how to create and format worksheets, enter and edit data, and use formulas and functions. They will also learn how to use the various charting and graphing tools to visualize data.
In addition, students will learn how to use the data analysis tools in Excel to perform basic statistical analysis. They will learn how to use the PivotTable and PivotChart tools to summarize and analyze data, and how to use the Solver tool to solve optimization problems.
Finally, students will learn how to use the Power Query and Power Pivot tools to import and analyze data from external sources. They will also learn how to use the Power BI tool to create interactive dashboards and reports.
By the end of the course, students will have a good understanding of the features and functions of Excel, and how to use them to analyze data. They will be able to create worksheets, enter and edit data, use formulas and functions, and create charts and graphs. They will also be able to use the data analysis tools to summarize and analyze data, and create interactive dashboards and reports.
[Applications]
The application of this course can be seen in many areas. It can be used to analyze data in the fields of finance, marketing, and business. It can also be used to create reports and dashboards to help visualize data. Additionally, it can be used to create data models to help make predictions and decisions. Finally, it can be used to create data visualizations to help communicate data insights.
[Career Paths]
1. Data Analyst: Data Analysts are responsible for collecting, organizing, and analyzing data to help inform business decisions. They use a variety of tools, such as Excel, to create reports and dashboards that provide insights into the data. As data becomes increasingly important in the business world, the demand for Data Analysts is expected to continue to grow.
2. Business Intelligence Analyst: Business Intelligence Analysts use data to help organizations make better decisions. They use Excel to create reports and dashboards that provide insights into the data. They also use data to identify trends and opportunities for improvement. As businesses become more data-driven, the demand for Business Intelligence Analysts is expected to continue to grow.
3. Data Scientist: Data Scientists use data to solve complex problems and develop new products and services. They use Excel to analyze data and create predictive models. As businesses become more data-driven, the demand for Data Scientists is expected to continue to grow.
4. Data Visualization Specialist: Data Visualization Specialists use data to create visualizations that help people understand complex data. They use Excel to create charts, graphs, and other visualizations that help people understand the data. As businesses become more data-driven, the demand for Data Visualization Specialists is expected to continue to grow.
[Education Paths]
1. Bachelor of Science in Data Science: This degree path focuses on the development of skills in data analysis, data mining, machine learning, and artificial intelligence. It also covers topics such as data visualization, predictive analytics, and big data. This degree path is becoming increasingly popular as businesses and organizations rely more heavily on data-driven decision making.
2. Master of Science in Business Analytics: This degree path focuses on the application of data analysis and analytics to business problems. It covers topics such as data mining, predictive analytics, and machine learning. This degree path is becoming increasingly popular as businesses and organizations rely more heavily on data-driven decision making.
3. Master of Science in Data Science: This degree path focuses on the development of skills in data analysis, data mining, machine learning, and artificial intelligence. It also covers topics such as data visualization, predictive analytics, and big data. This degree path is becoming increasingly popular as businesses and organizations rely more heavily on data-driven decision making.
4. Master of Science in Data Engineering: This degree path focuses on the development of skills in data engineering, data warehousing, and data management. It also covers topics such as data modeling, data security, and data governance. This degree path is becoming increasingly popular as businesses and organizations rely more heavily on data-driven decision making.
Course Provider

Provider QuickStart's Stats at AZClass
Discussion and Reviews
0.0 (Based on 0 reviews)
Explore Similar Online Courses

Coding the Matrix: Linear Algebra through Computer Science Applications

Adobe Audition: Sound post-production for Film Documentary Interview and clips

Python for Informatics: Exploring Information

Social Network Analysis

Introduction to Systematic Review and Meta-Analysis

The Analytics Edge

DCO042 - Python For Informatics

Causal Diagrams: Draw Your Assumptions Before Your Conclusions
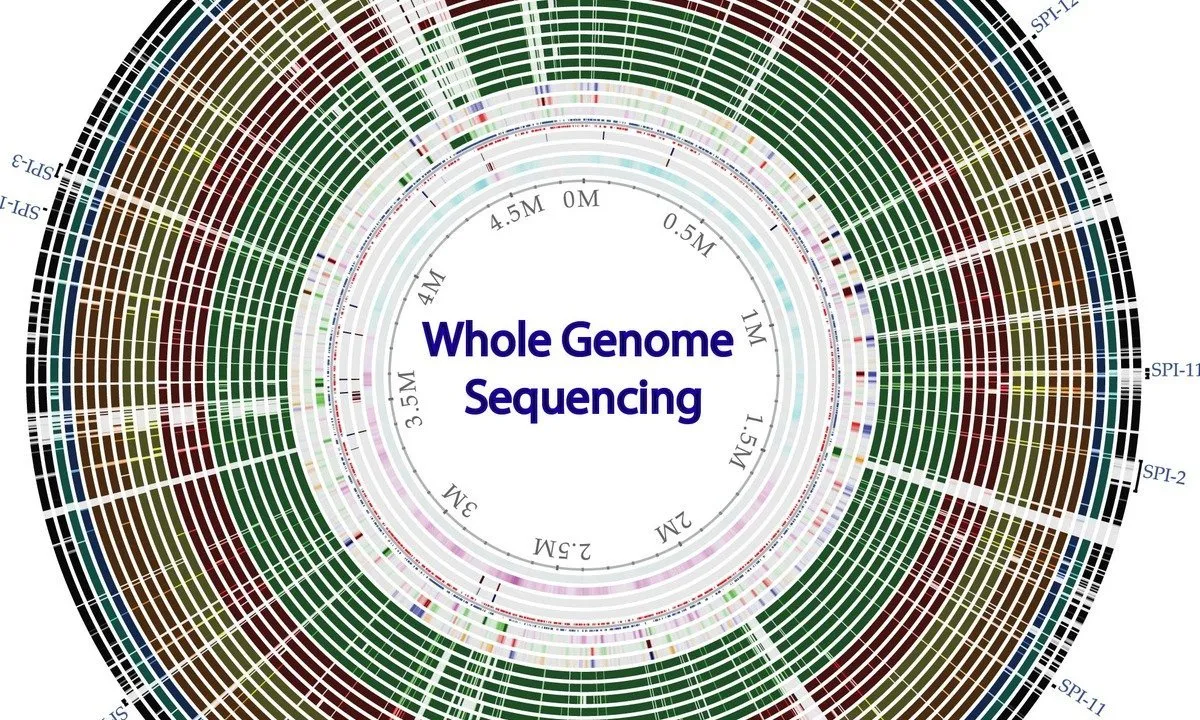
Whole genome sequencing of bacterial genomes - tools and applications

The Data Analyst Course: Complete Data Analyst Bootcamp

Data Analysis in Excel

Database Design
 Related Categories
 Popular Providers
Quiz
 Submitted Sucessfully
1. What is Excel?
2. What is the purpose of Excel?
3. What is the most popular data analysis tool?

Start your review of Introduction to Data Analysis using Excel