

Introduction to Data Visualization Tools 
This course introduces the fundamentals of data visualization tools, which are essential for data scientists and analysts to interpret large data sets. It covers topics such as multidimensional visualization (Type I and Type II), open source and commercial visualization tools. With these tools, data visualization designers can create visual representations of large data sets quickly and easily, which can be used for a variety of purposes such as dashboards, annual reports, sales and marketing materials, and investor slide decks. Click this course to learn more about data visualization tools and how to use them to make sense of large data sets. ▼
ADVERTISEMENT
Course Feature
![]() Cost:
Cost:
Free
![]() Provider:
Provider:
Udemy
![]() Certificate:
Certificate:
No Information
![]() Language:
Language:
English
![]() Start Date:
Start Date:
2021-09-14
Course Overview
❗The content presented here is sourced directly from Udemy platform. For comprehensive course details, including enrollment information, simply click on the 'Go to class' link on our website.
Updated in [August 31st, 2023]
Skills and Knowledge:
In this course, you will acquire skills and knowledge related to data visualization tools, including:
- Understanding the basics of data visualization and its importance
- Learning about different types of data visualization tools, such as multidimensional visualization (Type I and Type II) and open source and commercial visualization tools
- Understanding the principles of data visualization, such as data representation, data analysis, and data interpretation
- Learning how to use data visualization tools to create visual representations of large data sets
- Understanding how to use data visualization tools to create dashboards, annual reports, sales and marketing materials, investor slide decks, and other data-driven documents
- Learning how to interpret data visualizations and draw meaningful conclusions from them.
Professional Growth:
This course contributes to professional growth by providing an introduction to data visualization tools. By learning about the different types of data visualization tools, designers will be able to create visual representations of large data sets more quickly and efficiently. This will enable them to create more effective dashboards, annual reports, sales and marketing materials, investor slide decks, and other materials that require data visualization. Additionally, this course will provide an overview of both open source and commercial visualization tools, giving designers the opportunity to explore different options and find the best tool for their needs.
Further Education:
This course titled "Introduction to Data Visualization Tools" is suitable for preparing further education. It covers various data visualization tools, including multidimensional visualization, open source and commercial visualization tools. Data visualization is an important skill in the fields of data science and data analytics, and understanding and using these tools can be beneficial for further education in these areas.
Course Syllabus
Introduction
Course Provider

Provider Udemy's Stats at AZClass
Discussion and Reviews
0.0 (Based on 0 reviews)
Explore Similar Online Courses

The Complete Shopify DropShipping Course(From Zero To Hero!)

Algorithms in Competitive Programming: Maths Puzzles I

Python for Informatics: Exploring Information

Social Network Analysis

Introduction to Systematic Review and Meta-Analysis

The Analytics Edge

DCO042 - Python For Informatics

Causal Diagrams: Draw Your Assumptions Before Your Conclusions
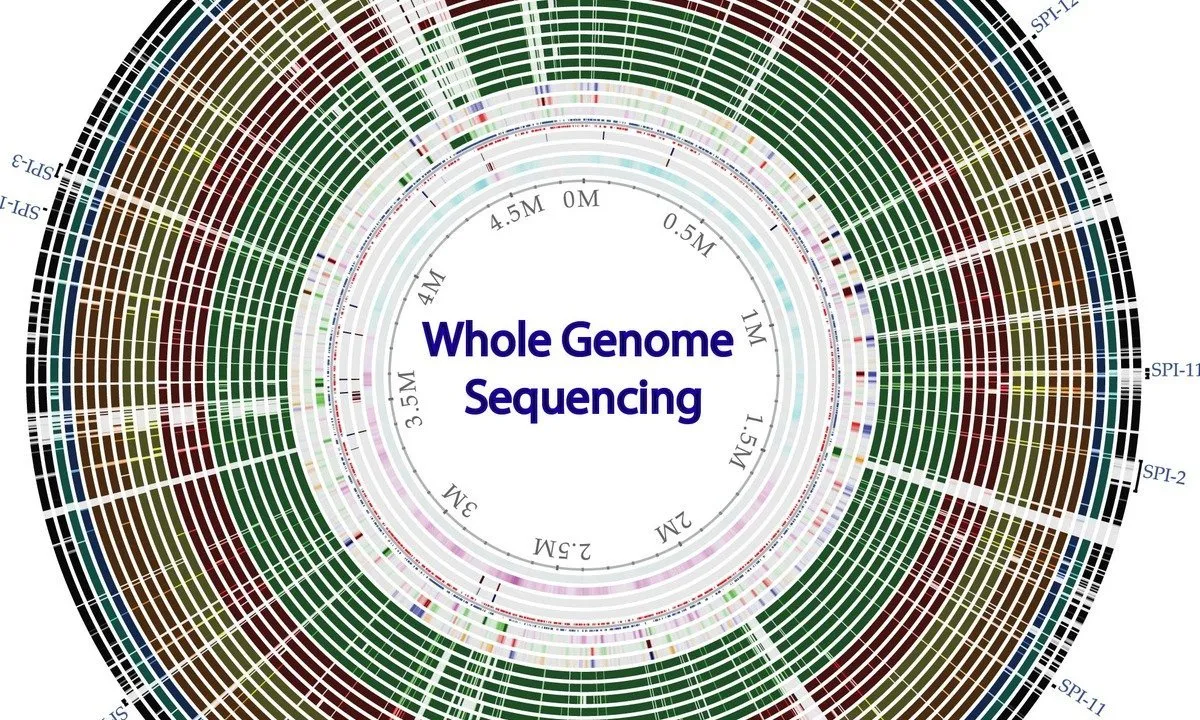
Whole genome sequencing of bacterial genomes - tools and applications

Augmented Data Visualization with Machine Learning

Data Visualization

Start your review of Introduction to Data Visualization Tools