

Free Tableau Course: Data Visualization in Tableau 
This course provides an introduction to data visualisation in Tableau. It covers topics such as adding filters, secondary axes, blending data and joins. Learners will gain the skills to create dashboards and visualise data in Tableau. ▼
ADVERTISEMENT
Course Feature
![]() Cost:
Cost:
Free
![]() Provider:
Provider:
Youtube
![]() Certificate:
Certificate:
Paid Certification
![]() Language:
Language:
English
![]() Start Date:
Start Date:
On-Demand
Course Overview
❗The content presented here is sourced directly from Youtube platform. For comprehensive course details, including enrollment information, simply click on the 'Go to class' link on our website.
Updated in [February 21st, 2023]
What does this course tell?
(Please note that the following overview content is from the original platform)
Learn to visualise data using Tableau and build dashboards in Tableau. The tutorial also covers adding a filter in Tableau, adding a secondary axis, blending data and joins in Tableau
We consider the value of this course from multiple aspects, and finally summarize it for you from three aspects: personal skills, career development, and further study:
(Kindly be aware that our content is optimized by AI tools while also undergoing moderation carefully from our editorial staff.)
This free Tableau course is designed to help learners understand the fundamentals of data visualization in Tableau. It covers topics such as adding a filter in Tableau, adding a secondary axis, blending data and joins in Tableau. Learners will gain the skills to create interactive dashboards and visualizations to gain insights from data.
Data visualization is an important skill for anyone working with data. Tableau is a powerful tool for data visualization and analysis. This free Tableau course will help learners understand the fundamentals of data visualization in Tableau and gain the skills to create interactive dashboards and visualizations to gain insights from data.
This free Tableau course is a great starting point for learners who want to learn data visualization in Tableau. learners can further their knowledge by taking more advanced Tableau courses or exploring other data visualization tools.
[Related Learning Suggestions]
Learners who want to further their knowledge in data visualization can explore other data visualization tools such as Power BI, QlikView, and D3.js. They can also take more advanced Tableau courses to learn more about Tableau and data visualization.
[Applications]
After completing this Free Tableau Course: Data Visualization in Tableau, participants will be able to apply their knowledge to create interactive visualizations and dashboards in Tableau. They will be able to use filters, secondary axes, blending data, and joins to create more complex visualizations. Additionally, they will be able to use Tableau to explore and analyze data to gain insights.
[Career Paths]
1. Business Intelligence Analyst: Business Intelligence Analysts use Tableau to analyze data and create visualizations to help businesses make better decisions. They are responsible for developing and maintaining data models, creating dashboards, and providing insights to stakeholders. As the demand for data-driven decision making increases, the need for Business Intelligence Analysts is expected to grow.
2. Data Scientist: Data Scientists use Tableau to analyze large datasets and uncover trends and insights. They are responsible for developing algorithms, building predictive models, and creating visualizations to help businesses make better decisions. With the increasing demand for data-driven decision making, the need for Data Scientists is expected to grow.
3. Data Visualization Designer: Data Visualization Designers use Tableau to create visually appealing and informative data visualizations. They are responsible for designing and developing interactive dashboards, creating visualizations that are easy to understand, and providing insights to stakeholders. As the demand for data-driven decision making increases, the need for Data Visualization Designers is expected to grow.
4. Data Analyst: Data Analysts use Tableau to analyze data and uncover trends and insights. They are responsible for developing data models, creating visualizations, and providing insights to stakeholders. With the increasing demand for data-driven decision making, the need for Data Analysts is expected to grow.
Course Provider

Provider Youtube's Stats at AZClass
Over 100+ Best Educational YouTube Channels in 2023.
Best educational YouTube channels for college students, including Crash Course, Khan Academy, etc.
AZ Class hope that this free Youtube course can help your Tableau skills no matter in career or in further education. Even if you are only slightly interested, you can take Free Tableau Course: Data Visualization in Tableau course with confidence!
Discussion and Reviews
0.0 (Based on 0 reviews)
Explore Similar Online Courses

ETSY 101 : Shop Set-up and Promotion

Spring Boot and Spring Security with JWT including Access and Refresh Tokens

Python for Informatics: Exploring Information

Social Network Analysis

Introduction to Systematic Review and Meta-Analysis

The Analytics Edge

DCO042 - Python For Informatics

Causal Diagrams: Draw Your Assumptions Before Your Conclusions

Whole genome sequencing of bacterial genomes - tools and applications
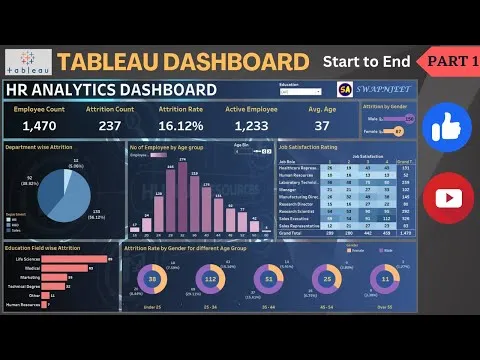
Tableau Dashboard from Start to End (Part 1) HR Dashboard Beginner to Pro Tableau Project
Tableau 10 for Data Scientists

Start your review of Free Tableau Course: Data Visualization in Tableau