

Data Visualization in Tableau 
Gain the skills to effectively communicate data insights with Tableau. This course covers the fundamentals of data visualization and provides hands-on practice to help you master the art of data storytelling. ▼
ADVERTISEMENT
Course Feature
![]() Cost:
Cost:
Free
![]() Provider:
Provider:
Udemy
![]() Certificate:
Certificate:
No Information
![]() Language:
Language:
English
![]() Start Date:
Start Date:
Self Paced
Course Overview
❗The content presented here is sourced directly from Udemy platform. For comprehensive course details, including enrollment information, simply click on the 'Go to class' link on our website.
Updated in [March 06th, 2023]
This course, Data Visualization in Tableau, covers the fundamentals of data visualization and how to apply design principles, human perception, color theory, and effective storytelling with data. It is designed for those who present data to others, aspire to be a business analyst or data scientist, or would like to become more effective with visualization tools. Participants will learn how to create and format visualizations, use calculations and parameters, and create interactive dashboards. By the end of the course, participants will be able to create compelling visualizations that effectively communicate data insights.
[Applications]
After completing this course, participants can apply their newfound knowledge to create compelling visualizations that effectively communicate data insights. They can also use Tableau to create interactive dashboards and stories that can be shared with colleagues and stakeholders. Additionally, participants can use the skills they have learned to create data-driven presentations that are both visually appealing and informative.
[Career Paths]
1. Business Analyst: Business analysts are responsible for analyzing data and providing insights to help inform business decisions. They use data visualization tools such as Tableau to create visualizations that help to identify trends and patterns in data. This role is becoming increasingly important as businesses rely more heavily on data-driven decision making.
2. Data Scientist: Data scientists use data visualization tools such as Tableau to explore and analyze data. They use their findings to develop predictive models and create data-driven solutions. This role is becoming increasingly important as businesses rely more heavily on data-driven decision making.
3. Data Visualization Designer: Data visualization designers use data visualization tools such as Tableau to create visualizations that help to identify trends and patterns in data. They use their design skills to create visually appealing and effective visualizations that help to communicate complex data in an easy-to-understand way. This role is becoming increasingly important as businesses rely more heavily on data-driven decision making.
4. Data Engineer: Data engineers use data visualization tools such as Tableau to create data pipelines and ETL processes. They use their engineering skills to design and develop data architectures that enable data to be collected, stored, and analyzed. This role is becoming increasingly important as businesses rely more heavily on data-driven decision making.
[Education Paths]
1. Bachelor of Science in Data Science: Data Science is a rapidly growing field that combines mathematics, computer science, and statistics to analyze and interpret data. This degree path provides students with the skills to develop and apply data-driven solutions to real-world problems. Students will learn to use data visualization tools such as Tableau to create meaningful visualizations that can be used to inform decision-making.
2. Master of Science in Business Analytics: Business Analytics is a field that focuses on the use of data to inform business decisions. This degree path provides students with the skills to analyze data, develop predictive models, and create data visualizations. Students will learn to use Tableau to create interactive visualizations that can be used to identify trends and patterns in data.
3. Master of Science in Data Science: Data Science is a field that combines mathematics, computer science, and statistics to analyze and interpret data. This degree path provides students with the skills to develop and apply data-driven solutions to real-world problems. Students will learn to use data visualization tools such as Tableau to create meaningful visualizations that can be used to inform decision-making.
4. Master of Science in Data Visualization: Data Visualization is a field that focuses on the use of data to create visual representations of data. This degree path provides students with the skills to create effective visualizations that can be used to identify trends and patterns in data. Students will learn to use Tableau to create interactive visualizations that can be used to inform decision-making.
The demand for data-driven professionals is increasing, and these degree paths provide students with the skills to become successful in the field. As technology advances, the need for data visualization tools such as Tableau will continue to grow, and these degree paths will provide students with the skills to create effective visualizations that can be used to inform decision-making.
Course Provider

Provider Udemy's Stats at AZClass
Data Visualization in Tableau covers the fundamentals of data visualization and provides practical exercises to help you master the art of data storytelling. This course will teach learners how to create visualizations that are both beautiful and informative. Students will also learn how to use Tableau to create interactive visualizations that can be used to explore data and reveal insights. Additionally, learners will understand how to use data to tell stories and communicate complex ideas in a clear and concise manner. Finally, learners will learn how to use Tableau to create dashboards and reports that can be used to present data to others.
Discussion and Reviews
0.0 (Based on 0 reviews)
Explore Similar Online Courses

2020-21 Updated : Bookkeeping & Accountancy Complete Course

Blockchain and Deep Learning: Future of AI

Python for Informatics: Exploring Information

Social Network Analysis

Introduction to Systematic Review and Meta-Analysis
The Analytics Edge

DCO042 - Python For Informatics

Causal Diagrams: Draw Your Assumptions Before Your Conclusions
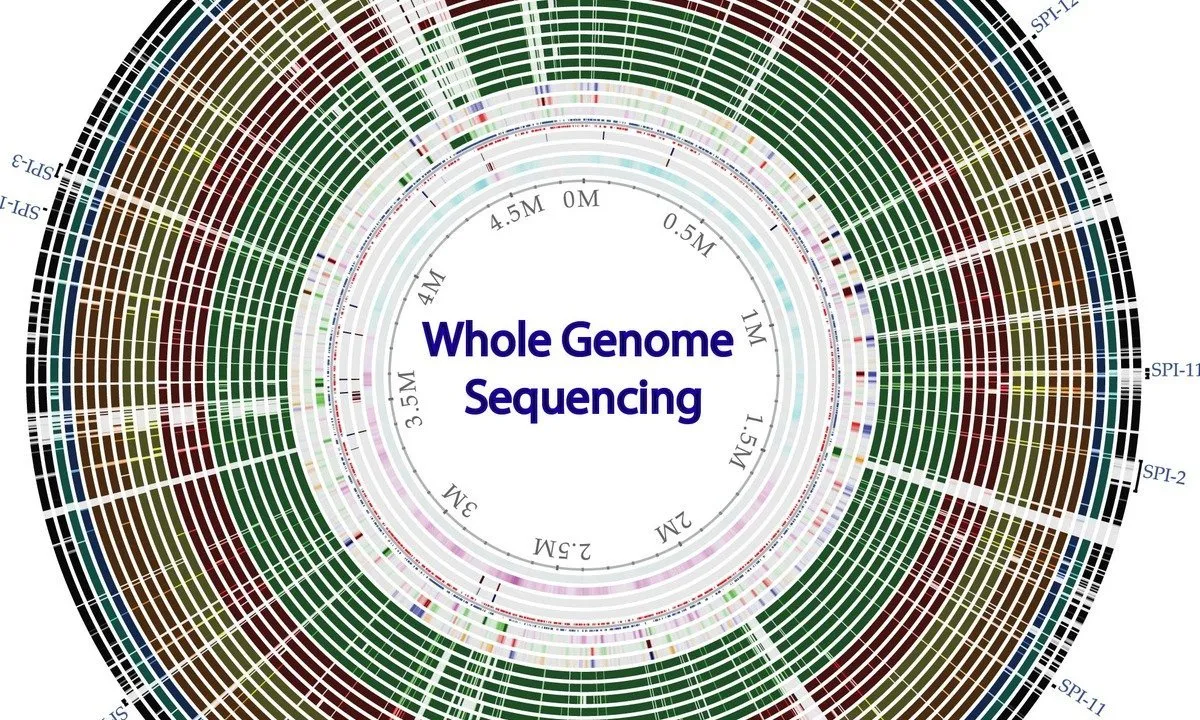
Whole genome sequencing of bacterial genomes - tools and applications
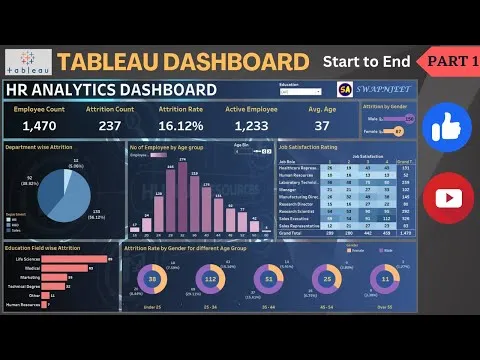
Tableau Dashboard from Start to End (Part 1) HR Dashboard Beginner to Pro Tableau Project
Tableau 10 for Data Scientists

Start your review of Data Visualization in Tableau